Urban tree monitoring
Map reflectance differences across accessible canopies to prioritise arboricultural inspection—not to certify tree safety.
 Get a quote
SOLUTION / VEGETATION HEALTH MONITORING
Turn Aerial Imagery into Actionable Vegetation Insights
Repeatable, georeferenced spectral observations that complement tree inspection, landscape management and ecological fieldwork.
01 / OPERATIONAL CONTEXT
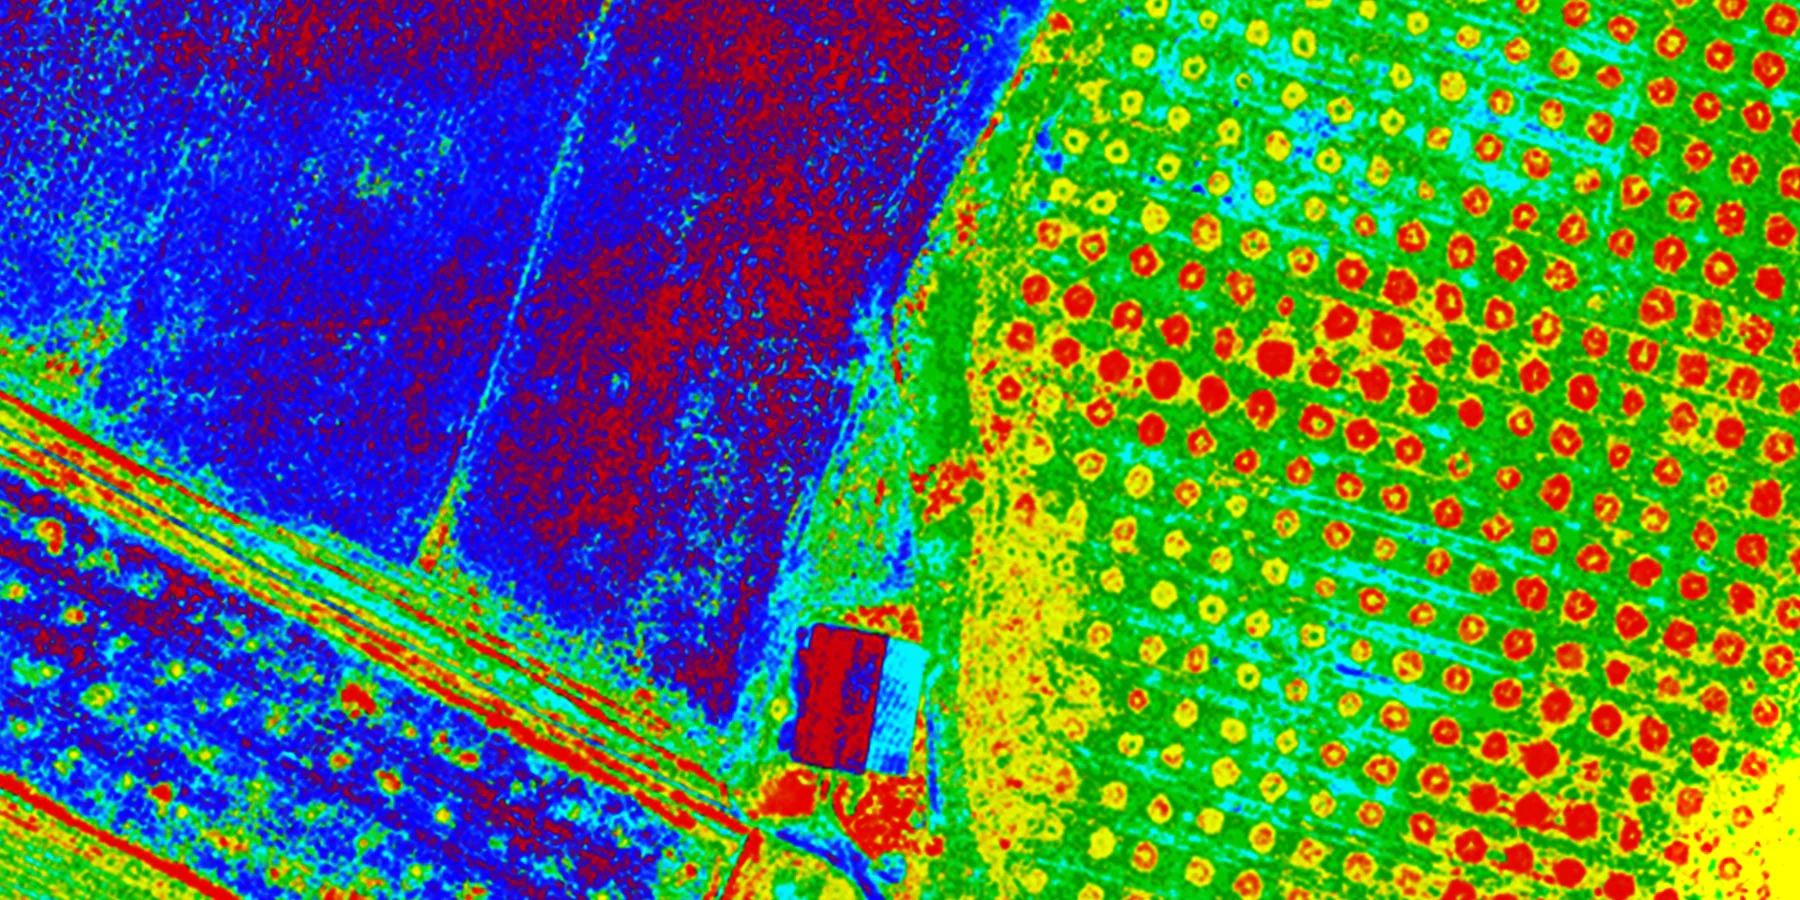
Visual inspection provides essential local evidence but can be difficult to repeat across large sites. Multispectral drone surveys add spatially consistent observations of canopy and vegetation reflectance, helping managers prioritise where to look more closely and how patterns change over time.
Easepect can discuss commissioned capture, product selection, technical demonstrations and integrated processing workflows in Singapore and Southeast Asia. Flight authorisation, site access, environmental constraints and professional responsibilities are reviewed separately.
02 / APPLICATIONS
Representative application contexts. Each requires a project-specific acquisition design and interpretation method.
Map reflectance differences across accessible canopies to prioritise arboricultural inspection—not to certify tree safety.
Compare managed vegetation across zones and identify areas where conditions differ from previous surveys.
Build repeatable corridor records where safe, authorised flight and ground access are available.
Review vegetation establishment and maintenance across defined land parcels.
Track revegetation and cover change using consistent acquisition and processing methods.
Create comparable datasets while documenting illumination, phenology and site changes between dates.
03 / RECOMMENDED WORKFLOW
The sequence keeps acquisition, processing, interpretation and validation distinct. It can be adapted to the site and professional scope.
Specify vegetation type, area, interval, baseline and the operational decision the survey should support.
Choose spectral and thermal measurements only where they serve the question; plan height, overlap and authorised access.
Use reflectance references and incident-light measurements, and record conditions relevant to comparison.
Generate orthomosaics and indices with compatible software, then inspect alignment, artefacts and data completeness.
Review current and previous observations, then target field inspection at meaningful anomalies.
Combine professional ground findings with GIS layers, maps and a monitoring report that states limitations.
04 / TYPICAL DELIVERABLES
Final formats and content are agreed around the intended GIS, research or operational use. An output is not automatically a certified survey or diagnostic conclusion.
Multispectral orthomosaics
NDVI and NDRE maps where supported
Validated vegetation classification maps
Georeferenced GeoTIFF files
GIS-compatible outputs
Repeat-survey comparison layers
Inspection-priority maps
Monitoring reports with method notes
05 / SENSOR SELECTION
These are starting points for discussion, not a claim that one model fits every site or application.
Focused five-band vegetation baseline
Review the sensorHigher spatial detail for canopy and plant-level investigation
Review the sensorAdds surface-temperature patterns for suitable studies
Review the sensor06 / INTERPRETATION BOUNDARY
Low or changing index values can be associated with many factors, including drought, nutrients, disease, shading, phenology, exposed soil or acquisition conditions. Multispectral monitoring cannot independently diagnose tree disease, nutrient deficiency or structural safety. Use qualified field inspection and other appropriate tests before action.
Do not submit sensitive site information, credentials, restricted imagery or confidential project details through the general enquiry form.
07 / RELATED PUBLISHED RESEARCH
Manufacturer-published third-party cases. They are not Easepect projects and do not establish a universal method or result.
Oklahoma State University / Lake Carl Blackwell, Oklahoma, USA
Researchers completed thirteen flights from April to October, combining drone multispectral imagery with Sentinel-2 observations. Over water, they increased image overlap to 80% to support reconstruction in a difficult photogrammetric environment.
Read the original case studyAGRON / Hungary
AGRON combined multispectral imagery with SPAD measurements and AGRONmaps to study chlorophyll/nitrogen-related variation and infection focal points across research plots.
Read the original case study08 / FREQUENTLY ASKED QUESTIONS
No. It can identify canopy spectral patterns for further investigation, but structural safety and tree condition require appropriate professional inspection and validation.
The interval depends on species, growth stage, management risk, weather and the decision being supported. A repeatable baseline and consistent acquisition method are usually more useful than an arbitrary schedule.
No. Thresholds vary with species, canopy structure, phenology, illumination, background and processing. Develop and validate interpretation for the specific monitoring context.
Yes. Supported orthomosaics, reflectance products, index rasters and validated vector layers can be exported in georeferenced formats for GIS analysis and reporting.
SELECT / DEMONSTRATE / INTEGRATE
Share the application, approximate project area, current drone platform, desired outputs and timeline. Easepect can define a practical discussion around survey services, equipment, processing and training while keeping field validation and professional responsibilities explicit.