Wetland monitoring
Map vegetation patterns and support repeat assessment while managing reconstruction challenges over water.
 Get a quote
SOLUTION / ENVIRONMENTAL MONITORING
Better Spatial Information for Environmental Decisions
Detailed spectral observations for wetlands, coastal habitats, restoration sites and ecological research—integrated with GIS and field evidence.
01 / OPERATIONAL CONTEXT
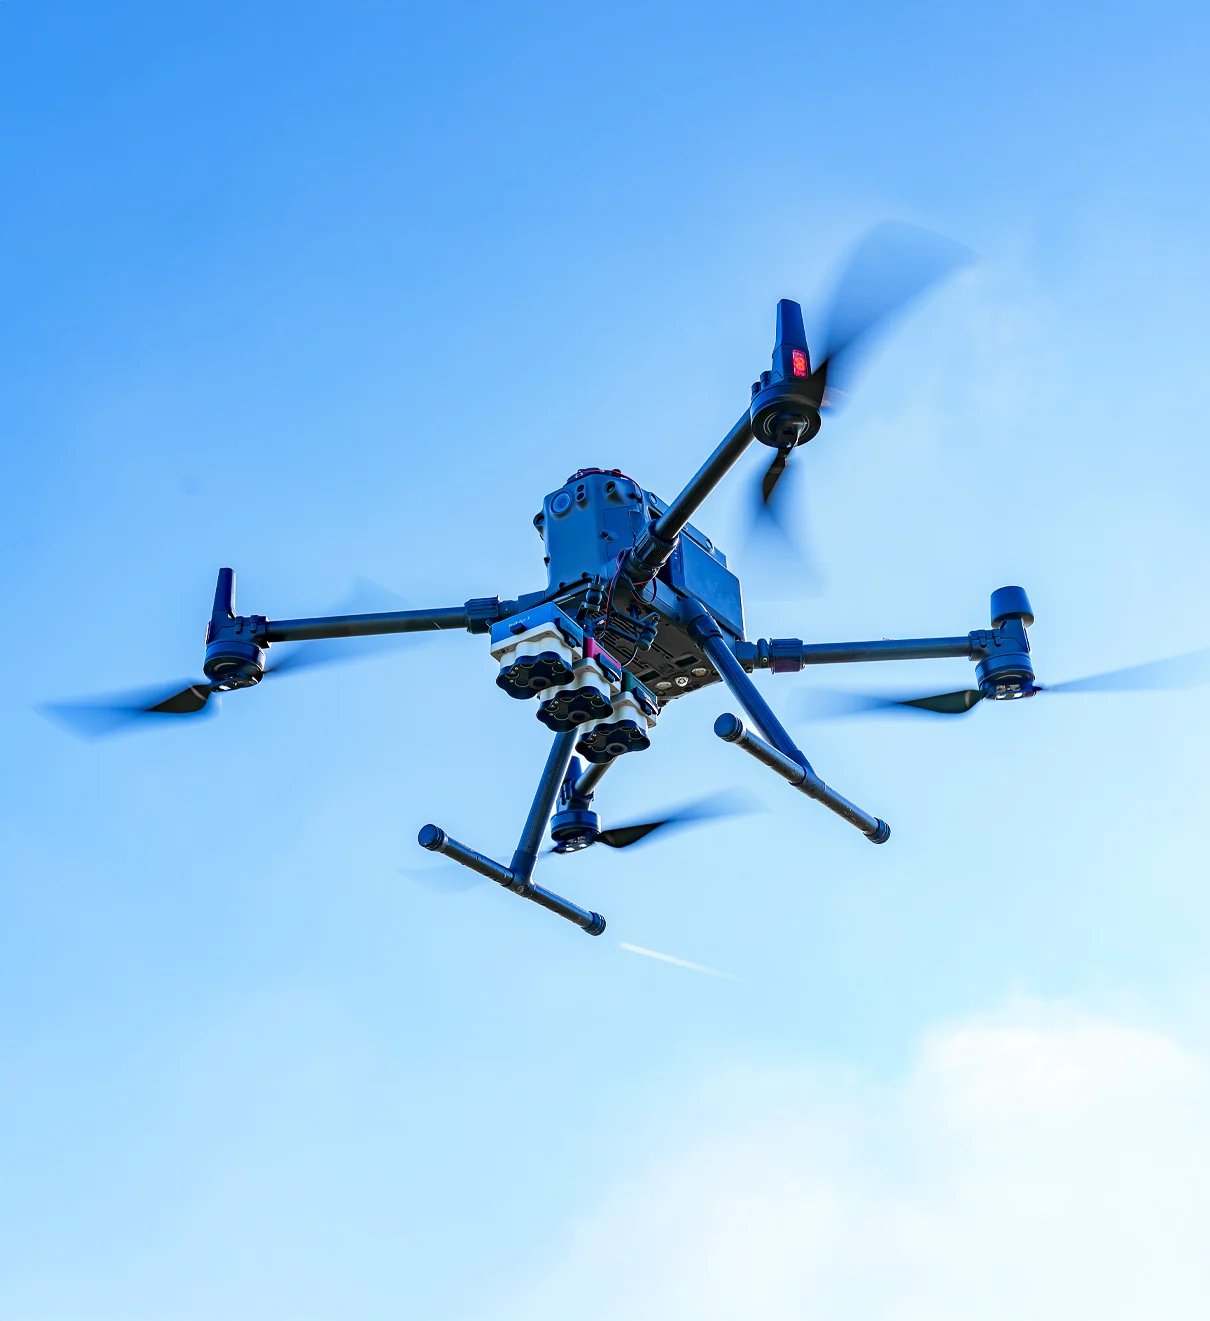
Environmental sites often combine fragmented habitats, difficult access and seasonal change. Drone multispectral surveys can provide detailed spatial context between field plots and coarser satellite imagery. Their value depends on a clear monitoring design, suitable timing and ecological validation.
Easepect can discuss commissioned capture, product selection, technical demonstrations and integrated processing workflows in Singapore and Southeast Asia. Flight authorisation, site access, environmental constraints and professional responsibilities are reviewed separately.
02 / APPLICATIONS
Representative application contexts. Each requires a project-specific acquisition design and interpretation method.
Map vegetation patterns and support repeat assessment while managing reconstruction challenges over water.
Examine canopy and habitat variation at a spatial scale appropriate to the site and research question.
Compare vegetation establishment and land-cover change against baseline surveys and field plots.
Develop validated mapping methods and monitor changes following management interventions.
Document vegetation condition and spatial change across former or actively managed land.
Combine spectral, structural and field measurements in a defined scientific methodology.
03 / RECOMMENDED WORKFLOW
The sequence keeps acquisition, processing, interpretation and validation distinct. It can be adapted to the site and professional scope.
Define habitats, reference plots, target variables, survey windows and how drone observations will be validated.
Address access, airspace authorisation, wildlife disturbance, tides, water, weather and safe operations before acquisition.
Use multispectral, thermal, RGB, LiDAR or field instruments only where each contributes to the method.
Control calibration, image overlap, altitude and environmental records, with additional care over water or heterogeneous terrain.
Document radiometric correction, indices, training data, classification parameters and quality checks.
Combine maps with field observations and authoritative environmental records; retain uncertainty in conclusions.
04 / TYPICAL DELIVERABLES
Final formats and content are agreed around the intended GIS, research or operational use. An output is not automatically a certified survey or diagnostic conclusion.
Georeferenced multispectral mosaics
Reflectance and vegetation-index rasters
Habitat or land-cover classifications with validation notes
Repeat-survey change layers
Field-investigation priority maps
GIS datasets and metadata
Survey method and quality records
Environmental monitoring maps and reports
05 / SENSOR SELECTION
These are starting points for discussion, not a claim that one model fits every site or application.
Ten-band research and habitat-classification workflows
Review the sensorFifteen-band customised ecological analysis
Review the sensorHigher-detail thermal and multispectral research, subject to availability
Review the sensor06 / INTERPRETATION BOUNDARY
Spectral variation can arise from tides, water, illumination, phenology, soil background, shadows or processing as well as ecological change. Classification and biomass models need representative reference data and validation. Do not transfer published case-study thresholds or models to another habitat without testing.
Do not submit sensitive site information, credentials, restricted imagery or confidential project details through the general enquiry form.
07 / RELATED PUBLISHED RESEARCH
Manufacturer-published third-party cases. They are not Easepect projects and do not establish a universal method or result.
Oklahoma State University / Lake Carl Blackwell, Oklahoma, USA
Researchers completed thirteen flights from April to October, combining drone multispectral imagery with Sentinel-2 observations. Over water, they increased image overlap to 80% to support reconstruction in a difficult photogrammetric environment.
Read the original case studyUniversity of Cádiz / Southern Spain
Professors Luis Barbero and Gloria Peralta and Dr. Andrea Celeste Curcio combined ten-band multispectral imagery with DJI Zenmuse L1 LiDAR on a Matrice 300 RTK. The manufacturer case reports thirteen vegetation indices processed in ENVI, with NDVI used as a vegetation mask; the academic abstract describes ARI2 with DSM information to help distinguish habitats dominated by Sarcocornia spp. and Sporobolus maritimus.
Read the original case study08 / FREQUENTLY ASKED QUESTIONS
No. Species differentiation depends on spectral and structural separability, image quality, timing, training data and validation. Some species or habitats may not be reliably distinguishable with the selected bands.
Water can provide weak or changing image features and complex reflectance. Mission overlap, reconstruction settings and quality control may need adjustment, as illustrated by the Oklahoma State University case study.
They are complementary. Drones can provide targeted high-spatial-detail acquisitions, while satellites offer broader coverage and established temporal records. The appropriate combination depends on scale and monitoring objectives.
No. Biomass estimation requires a model calibrated and validated with field reference data. Multispectral and LiDAR measurements can support that model but are not direct biomass measurements.
SELECT / DEMONSTRATE / INTEGRATE
Share the application, approximate project area, current drone platform, desired outputs and timeline. Easepect can define a practical discussion around survey services, equipment, processing and training while keeping field validation and professional responsibilities explicit.