Crop-vigour mapping
Visualise relative variation and identify zones for field inspection and comparison.
 Get a quote
SOLUTION / PRECISION AGRICULTURE
Monitor Crop Variability and Support Better Field Decisions
Georeferenced crop spectral information for scouting, research and management review—used with agronomy, field measurements and local context.
01 / OPERATIONAL CONTEXT
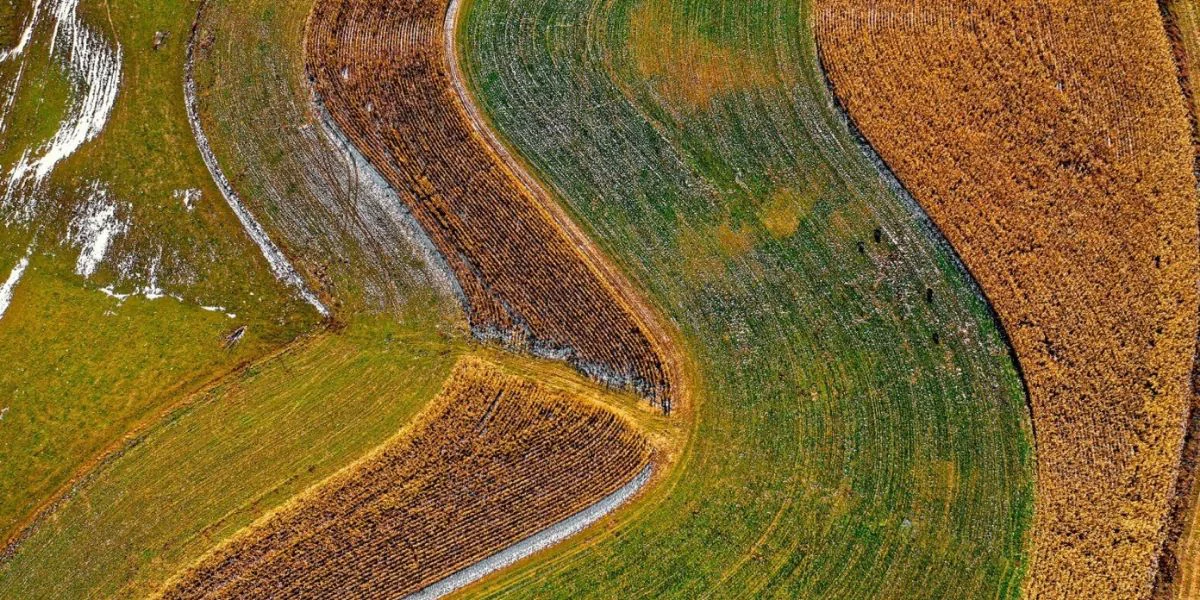
A multispectral survey reveals within-field reflectance patterns that may warrant scouting or comparison with treatment, soil, irrigation and yield records. The map is most valuable when it helps an agronomist ask a better field question—not when it is treated as an automatic recommendation.
Easepect can discuss commissioned capture, product selection, technical demonstrations and integrated processing workflows in Singapore and Southeast Asia. Flight authorisation, site access, environmental constraints and professional responsibilities are reviewed separately.
02 / APPLICATIONS
Representative application contexts. Each requires a project-specific acquisition design and interpretation method.
Visualise relative variation and identify zones for field inspection and comparison.
Evaluate counting algorithms where image resolution, plant separation and ground truth support a reliable method.
Compare spectral patterns through the season while accounting for canopy development and background changes.
Combine suitable spectral and thermal observations with irrigation records and field measurements.
Compare treatment plots using controlled acquisition, field measurements and agronomic interpretation.
Review spatial variability and treatment response across repeat surveys without assuming a universal threshold.
03 / RECOMMENDED WORKFLOW
The sequence keeps acquisition, processing, interpretation and validation distinct. It can be adapted to the site and professional scope.
Identify crop, growth stage, management zones, field records and the action the imagery should inform.
Select timing, height, overlap and calibration procedures appropriate to the crop and required outputs.
Record plant counts, SPAD or other relevant observations using a sampling design matched to the study.
Generate reflectance maps, orthomosaics and indices in compatible software and inspect data quality.
Compare patterns with soil, weather, irrigation, treatment and scouting evidence before making recommendations.
Deliver GIS-ready layers and monitor response using consistent, documented methods across dates.
04 / TYPICAL DELIVERABLES
Final formats and content are agreed around the intended GIS, research or operational use. An output is not automatically a certified survey or diagnostic conclusion.
RGB orthomosaic where supported by the workflow
Multispectral reflectance maps
NDVI, NDRE and other suitable index maps
Crop-variability layers
Plant-count outputs with validation where applicable
Georeferenced GeoTIFF and GIS data
Repeat-survey comparisons
Field scouting and monitoring maps
05 / SENSOR SELECTION
These are starting points for discussion, not a claim that one model fits every site or application.
Established five-band crop monitoring
Review the sensorDetailed scouting, plant counting and research
Review the sensorSpectral and thermal irrigation or water-stress studies
Review the sensor06 / INTERPRETATION BOUNDARY
Index values vary with species, cultivar, growth stage, canopy structure, soil background, illumination and processing. Fertiliser, irrigation or treatment decisions require appropriate field evidence and professional agronomic judgement. No yield increase, input saving or diagnostic performance is promised.
Do not submit sensitive site information, credentials, restricted imagery or confidential project details through the general enquiry form.
07 / RELATED PUBLISHED RESEARCH
Manufacturer-published third-party cases. They are not Easepect projects and do not establish a universal method or result.
Flydronair / Spain and Portugal
Flydronair used reflectance-panel captures before and after flights, DLS 2 measurements and fifteen-band imagery with custom indices, AI and agronomic interpretation. Manual or custom processing remained necessary where software did not yet support all Green bands.
Read the original case studyAGRON / Hungary
AGRON combined multispectral imagery with SPAD measurements and AGRONmaps to study chlorophyll/nitrogen-related variation and infection focal points across research plots.
Read the original case study08 / FREQUENTLY ASKED QUESTIONS
No. An index map alone is not a fertiliser prescription. Application decisions require agronomic interpretation, local field evidence and an appropriate management method.
Thermal data can add surface-temperature information to suitable irrigation and water-stress studies. It must be interpreted with weather, acquisition and field context and does not directly measure soil moisture.
No. Plant counting depends on spatial resolution, canopy separation, crop geometry, algorithm design and ground-truth validation. Evaluate performance on the intended crop and growth stage.
Share the crop, location at a non-sensitive level, approximate area, growth stage, drone platform, intended outputs, current field records and project timeline. Do not submit restricted site information through the general form.
SELECT / DEMONSTRATE / INTEGRATE
Share the application, approximate project area, current drone platform, desired outputs and timeline. Easepect can define a practical discussion around survey services, equipment, processing and training while keeping field validation and professional responsibilities explicit.